Native load models
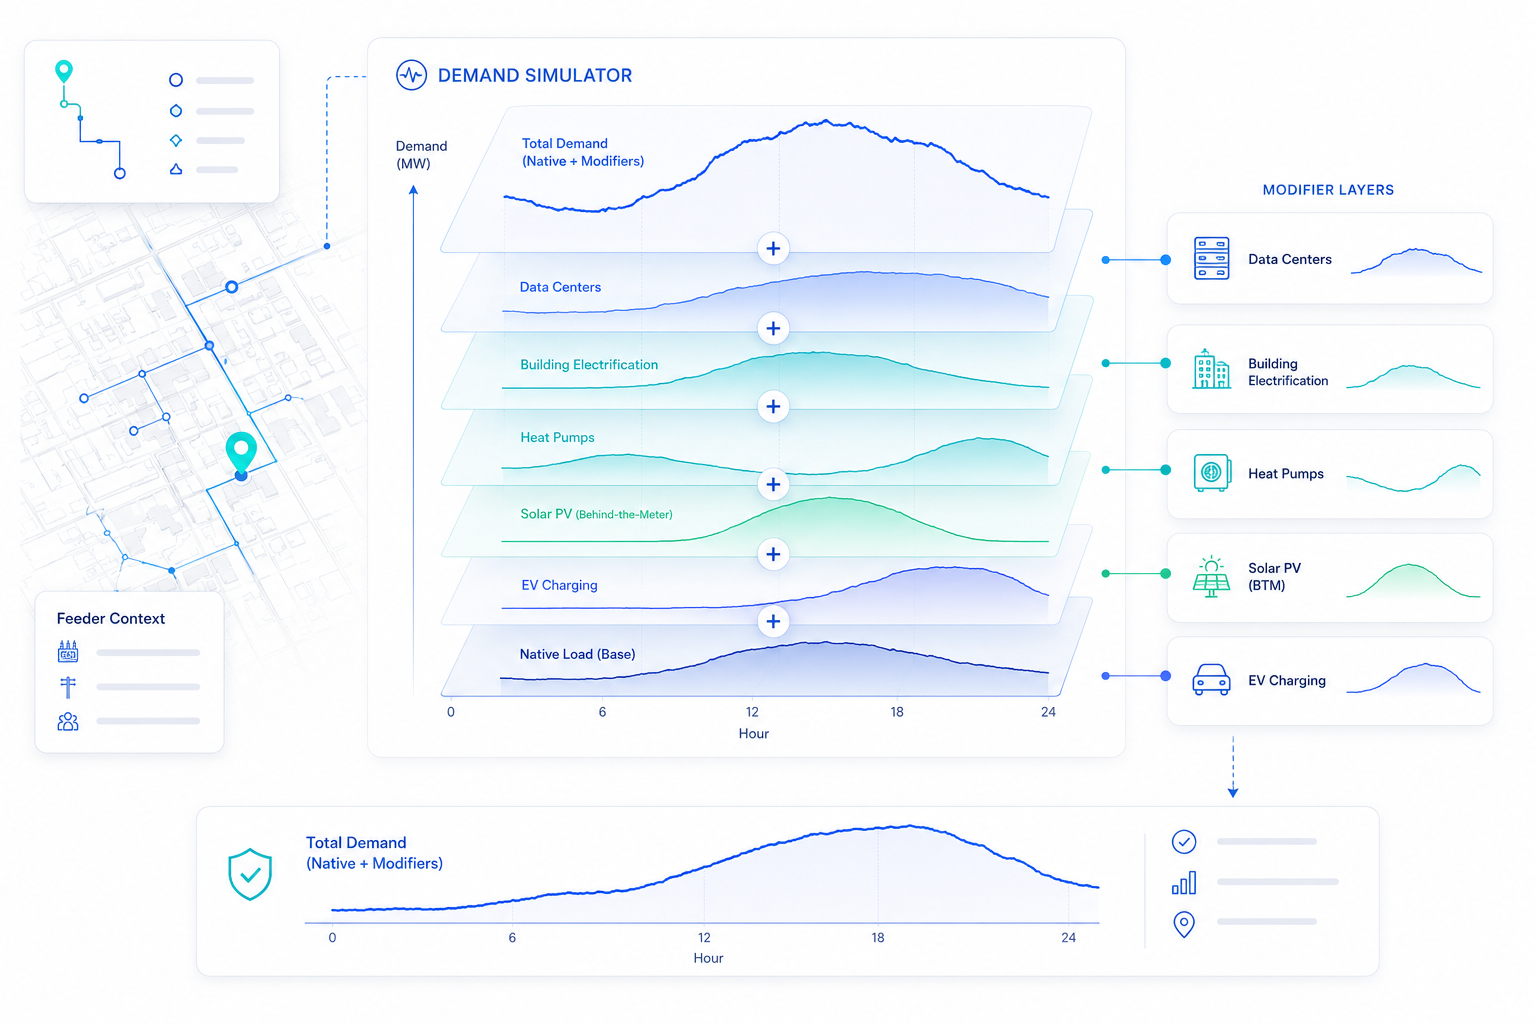
Native load models learn the continuation of historical demand patterns using measurement data, weather, calendar effects, economic activity, population, land use, and local grid context.
This layer represents business-as-usual demand before adding explicit future technology and large-load changes.
Preprocessing
The simulator supports anomaly detection, load transfer detection, and correction of artificial step changes. This protects the native model from learning operational artifacts as if they were true growth patterns.
Spatial forecasting
Customer and development growth is modeled using customer classes, building and postal-code data, land-use and zoning assumptions, known connection activity, and local growth projections.
GIS and electrical-network relationships allocate that growth to feeders, transformers, substations, service areas, and PoDs, allowing each area to follow a localized growth trajectory rather than a uniform system-wide rate.
Load modifiers
Load modifiers represent technology- and project-driven demand changes that historical load alone may not capture. Each modifier uses the same harmonized weather, economic, technology, and GIS assumptions as the native load model.
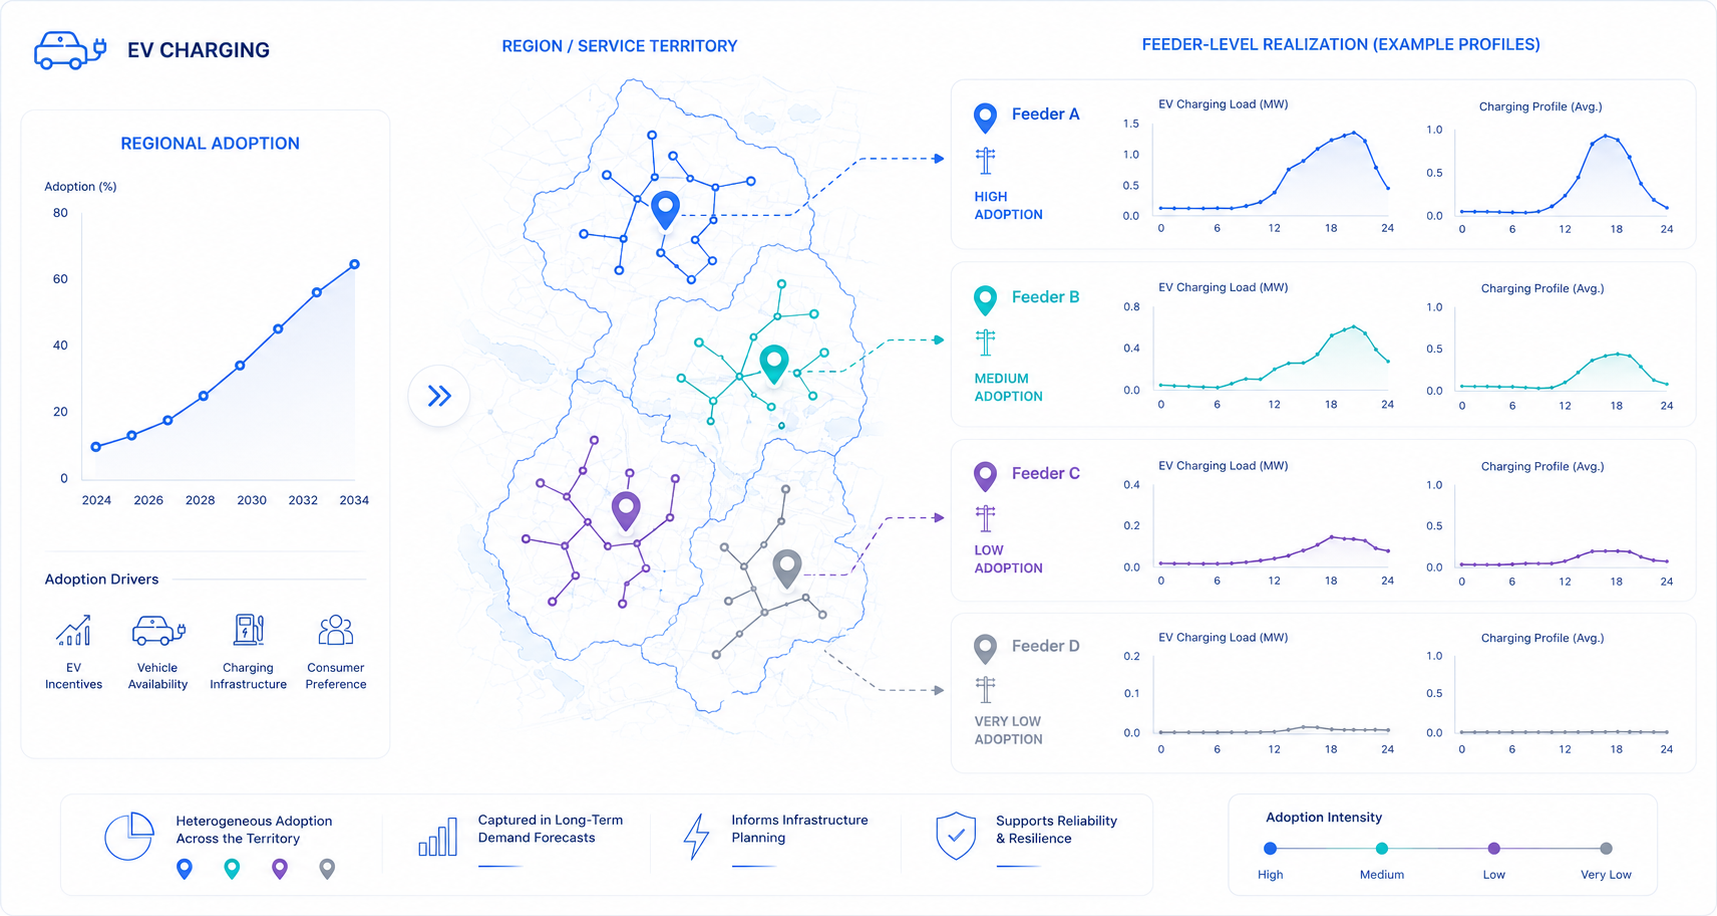
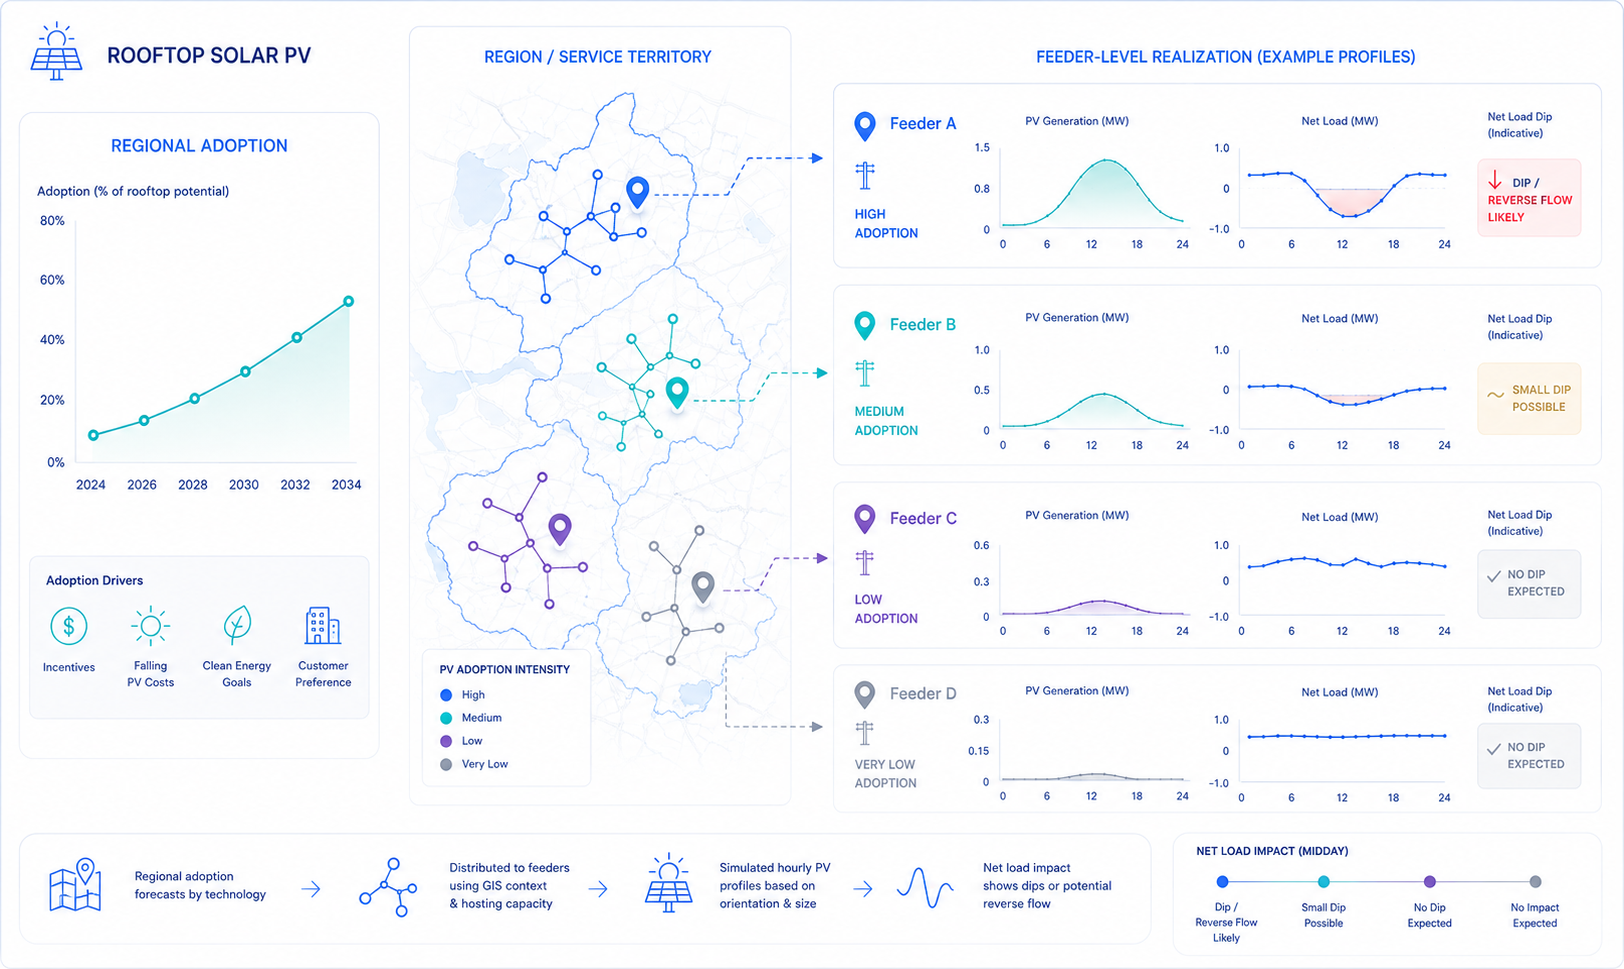
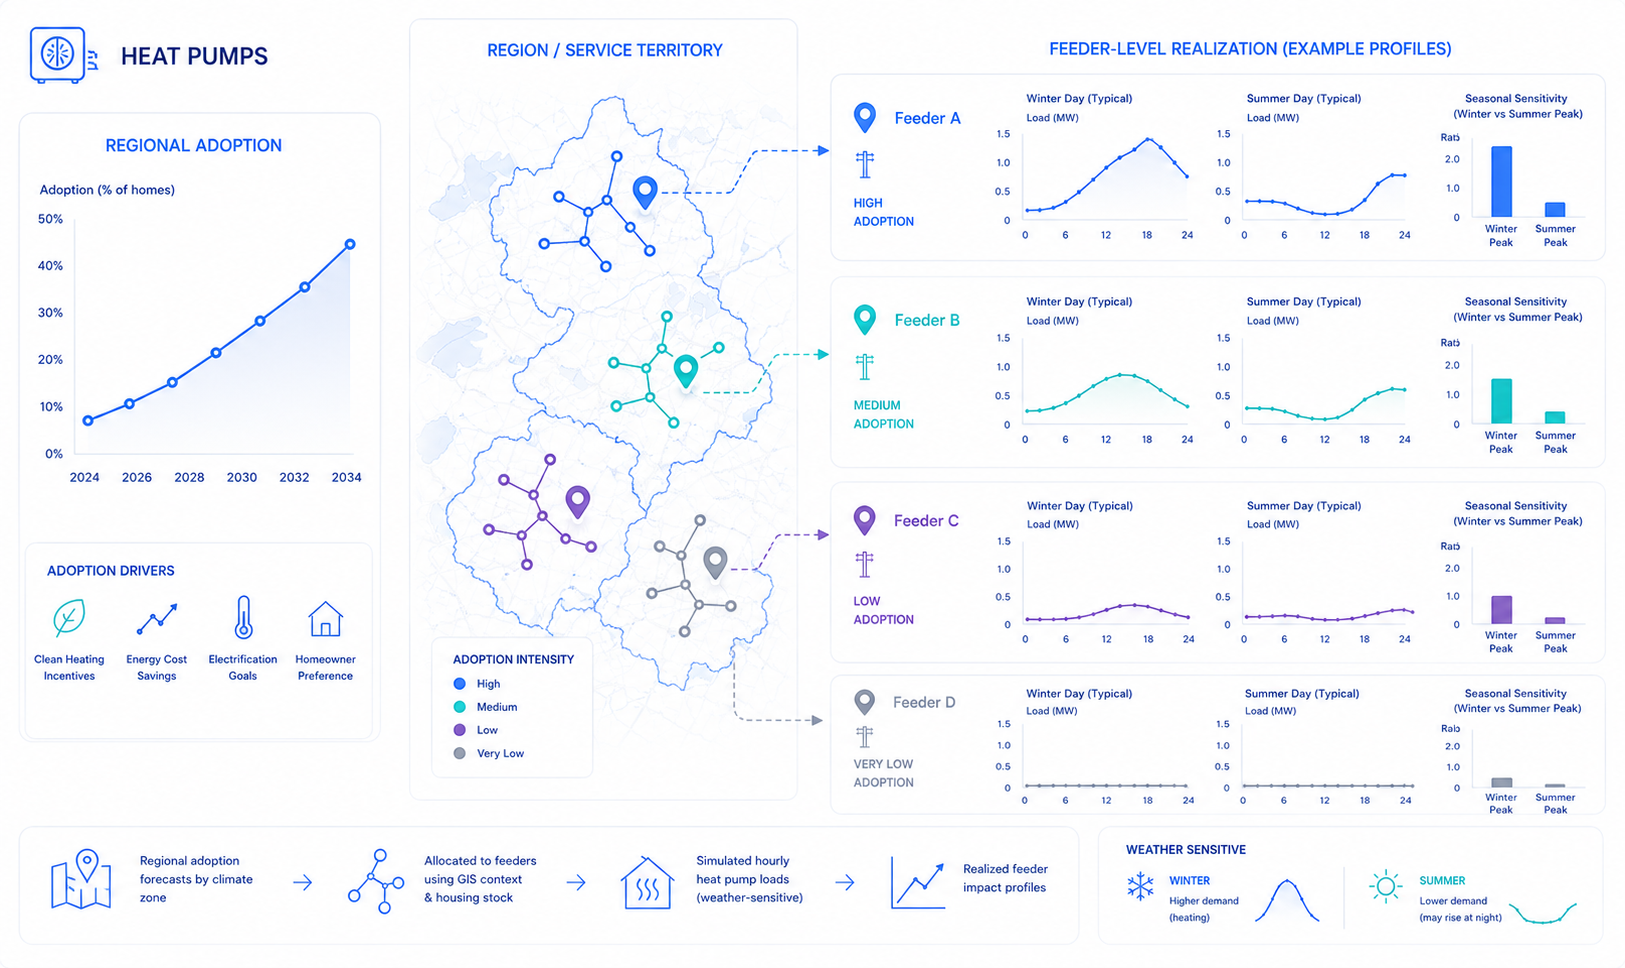
The spatial load growth framework translates regional adoption outlooks into localized feeder-level scenarios, so EV, PV, heat-pump, and air-conditioning growth is not spread uniformly across every neighborhood.
Existing electrifications are already embedded in historical trends. Known resources are separated out before the forecast runs to avoid double-counting in future scenarios
Load modifier
EV adoption is modeled from the harmonized input scenario, then allocated through GIS-informed relationships using economic, demographic, land-use, customer, and grid data. The output is a feeder-level realization of the scenario, rather than one uniform share spread evenly across every neighborhood.
Load modifier
PV and behind-the-fence generation are drawn from the same scenario as demand that is a single adoption, weather, economic, land-use, and grid draw propagated consistently across pillars. Geospatial models convert regional PV outlooks into feeder-level adoption scenarios, identifying where net-demand and reverse-flow impacts land first.
Load modifier
Heat pumps and electrified space conditioning reshape weather sensitivity by shifting the size, shape, and season of peak. The demand simulator draws these from the same scenario as everything else, translating regional heat-pump and AC outlooks into feeder-level adoption scenarios under one consistent adoption, weather, economic, building, and land-use draw.
Load modifier
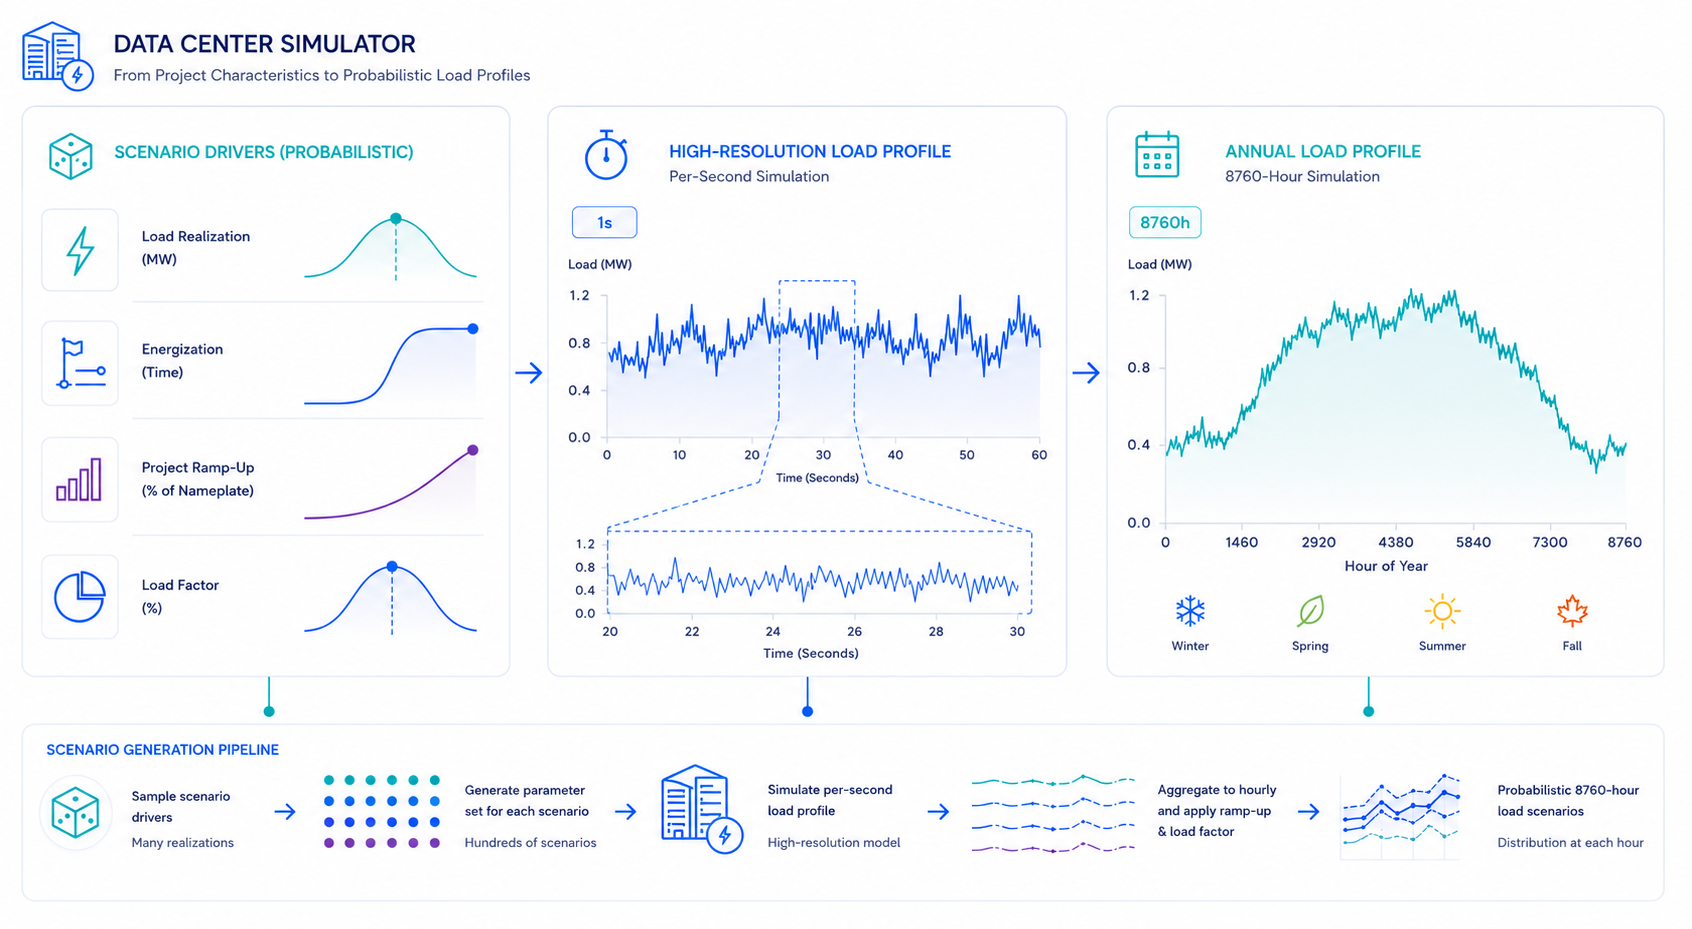
Data centers, industrial projects, new communities, and major developments are modeled as explicit additions rather than trend extrapolation. Each carries its own realization probability, energization date, staging and ramp-up, and hourly operating shape.
No double counting
Separating Embedded Load Modifiers from Future Scenarios
Historical load already reflects the rooftop PV, behind-the-fence generation, and other load modifiers that were operating at the time. To avoid double-counting, the simulator adjusts for known resources first to recover native load, then layers future load modifier scenarios.
Reconciliation
Demand scenarios can roll up from local assets to the system, allocate down from system assumptions to local assets, and compare distribution utility and system operator views. When forecasts diverge, the platform traces the mismatch back to the assumptions that produced it.