Probabilistic planning
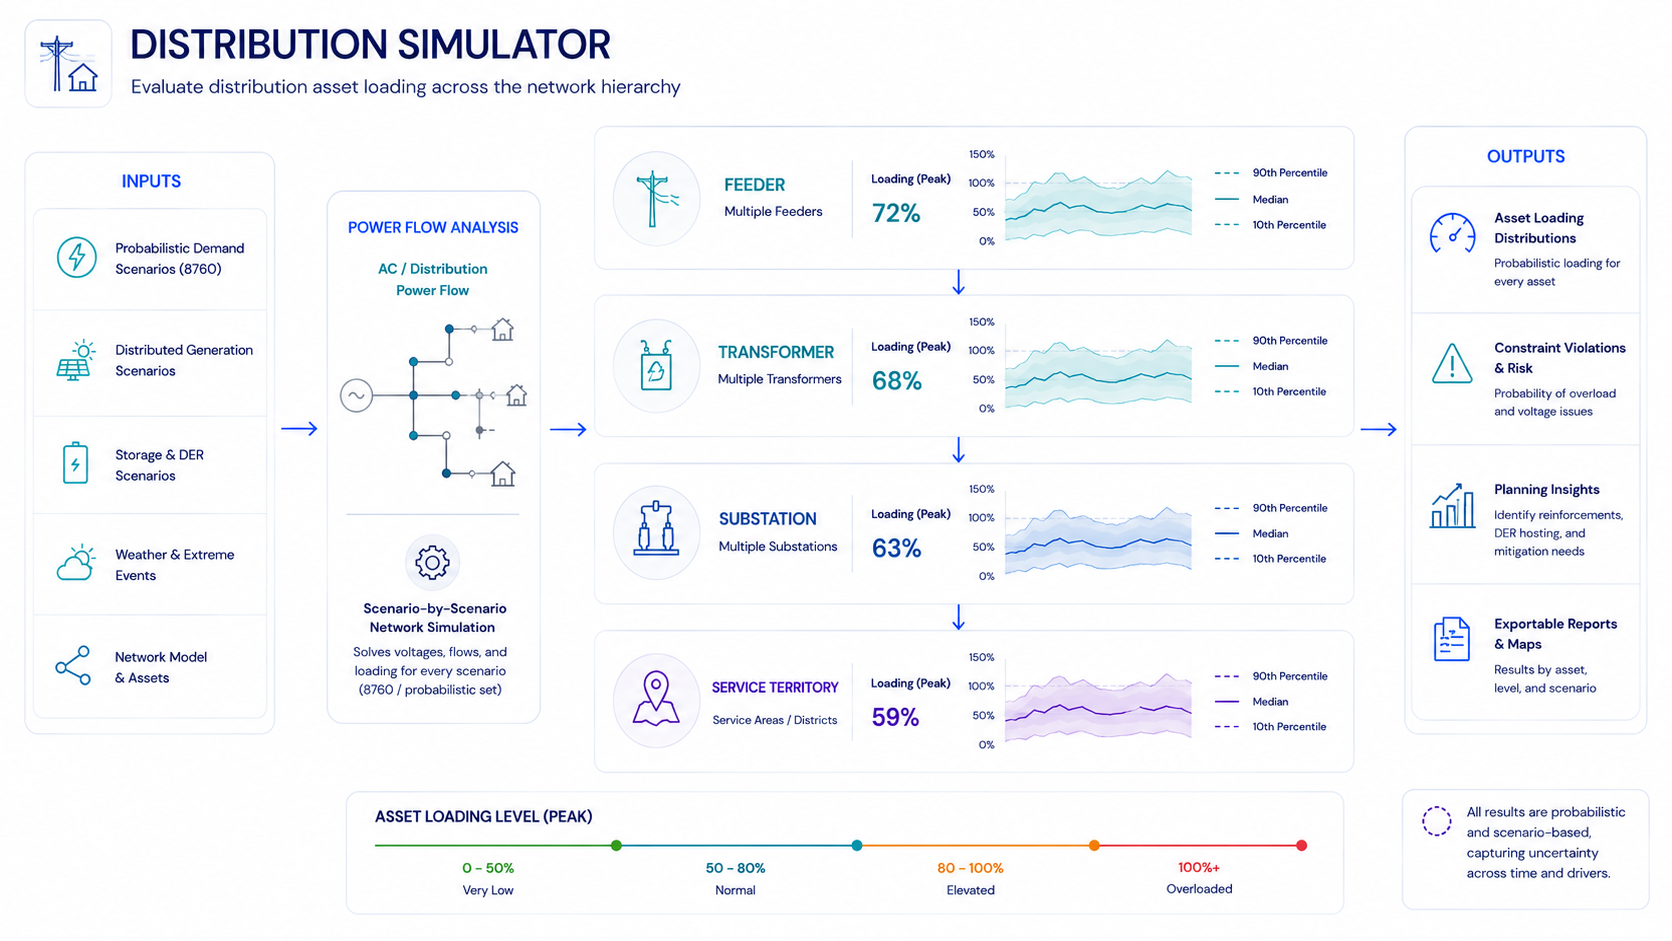
The simulator uses 8760-hour scenario families to show when asset stress emerges, which assumptions drive it, and how likely it is across plausible future conditions.
ASSET AND SYSTEM WELL-BEING
Each asset is assigned a well-being state (healthy, marginal, or at risk) across the full scenario family rather than at a single worst-case hour. Deficiencies are then ranked by the likelihood and severity of overload and contingency exposure, producing a risk-ordered queue of reinforcement needs and the years they arrive.
DER and reverse flow
Behind-the-fence PV, conventional generation, and other DERs reshape net load and can push power backward through the feeder. The simulator quantifies what that does to voltage, thermal loading, and remaining hosting capacity, under the same weather draw that produced the demand and supply scenarios.
Investment timing
Reinforcement projects are ranked by the severity and likelihood of the deficiencies they resolve, and each carries the year it becomes necessary. Comparing across load growth, DER, electrification, and large-load assumptions shows which projects hold their rank and their date under every scenario, and which move or fall away depending on what materializes.