Back to overview

Supply Simulator

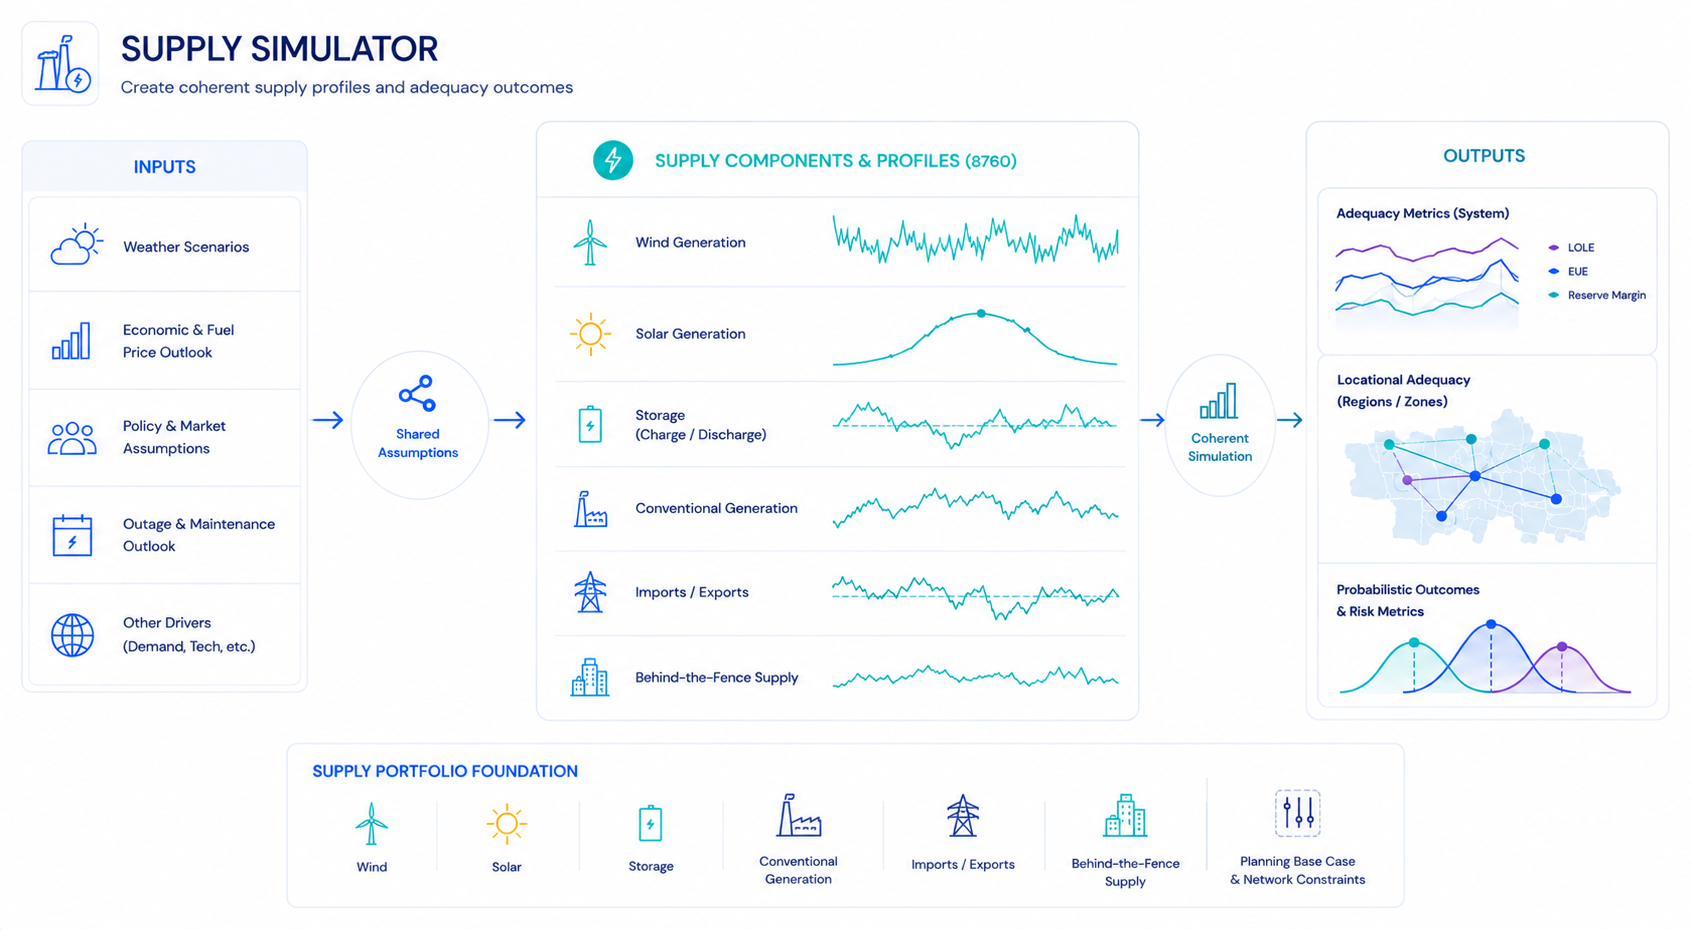
The supply simulator creates future generation, outage, derate, and offer scenarios from the same harmonized assumptions used by Demand Simulator.

Shared weather foundation

Modelling Supply and Demand using the Same Assumptions

Wind, solar, conventional generation, storage, imports/exports, cogeneration, and behind-the-fence supply use the same weather, climate, economic, growth, network, and scenario assumptions that drive demand.

Supply simulator showing shared inputs, supply profiles, coherent simulation, and adequacy outputs.
Spatially coherent renewable fleetIllustrative 24 h · normalized
AvailabilitySite outputShared weatherFleet aggregate
COLD FRONTCLOUD BAND Wind site AWind site BSolar siteFleet aggregate weather-linked deratesite outagecorrelated rampdiversity limits fleet drop 00h06h12h18h24h

Renewable fleet

Preserving Coincidental Output and Correlated Ramps

The simulator represents wind and solar availability and output across locations using spatially coherent weather scenarios, preserving fleet-wide coincidence, diversity, weather-linked derates and outages, and ramping behavior.

Conventional fleet

Representing Outages, Derates, and Offers

Conventional units are modeled with technical limits, outage history, forced and planned outage assumptions, weather-linked derates, marginal cost assumptions, and strategic or cost-based offer behavior.

Thermal availability and hourly offers
Available capacityIllustrative assets · 7-day scenario
Scenario 042 of 1,000Maximum capacitySelected scenarioOther scenarios
RCK1HLV2PRA3 250 MW max180 MW max320 MW max planned outageweather derateforced outage Day 1234567
Only capacity available at the selected hour enters the offer curve ↓
Asset offer curvesDay 7 · 18:00
Scenario 042 of 1,000Selected scenarioOther simulated scenarios
$0$50$100$150 $/MWh RCK1 · 250 MWHLV2 · 180 MWPRA3 · 320 MW 7011070607050801008060 0250 MW0180 MW0320 MW Offered quantity by asset (MW) Three blocks · Three blocks · Four blocks
Behind-the-fence supply and net loadIllustrative feeder
Solar generationConventional generationGross site loadNet load
LOCATION-AWARE SITE MODELFEEDER NET LOAD · 24 HOURS SUBSTATION MMmetermeter SITE A · BTF SOLARSITE B · BTF GENERATOR G EXPORTIMPORT REVERSE FLOW import0 MWexport 00h06h12h18h24h

Behind-the-fence supply

Connecting Distributed Generation to Local Net Load

Location-aware modelling of behind-the-fence solar and conventional distributed generation supports net-load studies and reverse power flow analysis in distribution systems.

Building a shared view of the future grid.

Request early access Back to overview